JLL’s Tour of India’s Top Residential Hotspots: Chennai Edition
Guindy, Pallikaranai and Poonamallee are Chennai’s top three residential hotspots.
The second edition of JLL’s Tour of India’s Top Residential Hotspots covers Chennai where Guindy, Pallikaranai and Poonamallee emerged as the top three residential hotspots. All these locations are driven by good development of IT / ITeS space that drive the residential demand in Chennai.
Through this report we aim to facilitate the complex decision making process by identifying three residential hotspots in India’s top cities through a multiple-criteria-decision-analysis. Some of the common drivers that make these locations prime include:
Let’s take a look at the number of residential units launched and sold in these micro-markets in the last five years.
Strong sales despite slow launches in Guindy, Pallikaranai and Poonamallee.
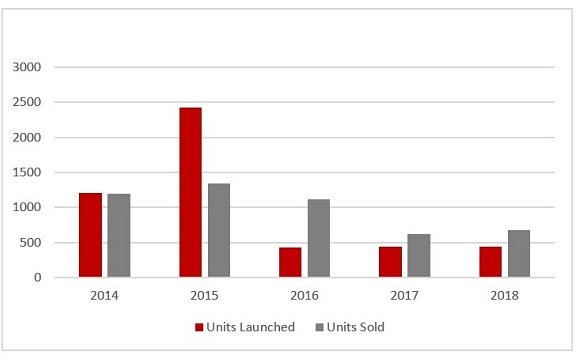
Source: JLL Research
Despite of overall slowdown in Chennai’s residential market, the hotspots witnessed stable sales in last three years (2016, 2017, and 2019). These hotspots are likely to benefit from the adjacent business parks with good supply in pipeline. Also increased job creation in IT and manufacturing along with improving connectivity driven by Chennai Metro Rail is likely to drive the demand for residential units in these hotspots. This is clearly seen from the 8% rise in units sold in 2018 over previous year. Benefits of good social infrastructure also attract more home buyers in these hotspots due to improved quality of life.
We’re analyzing Chennai’s top 15 residential micro-markets to arrive at the top 5.
Click on Connectivity, Quality of life or Real estate parameters to view results.
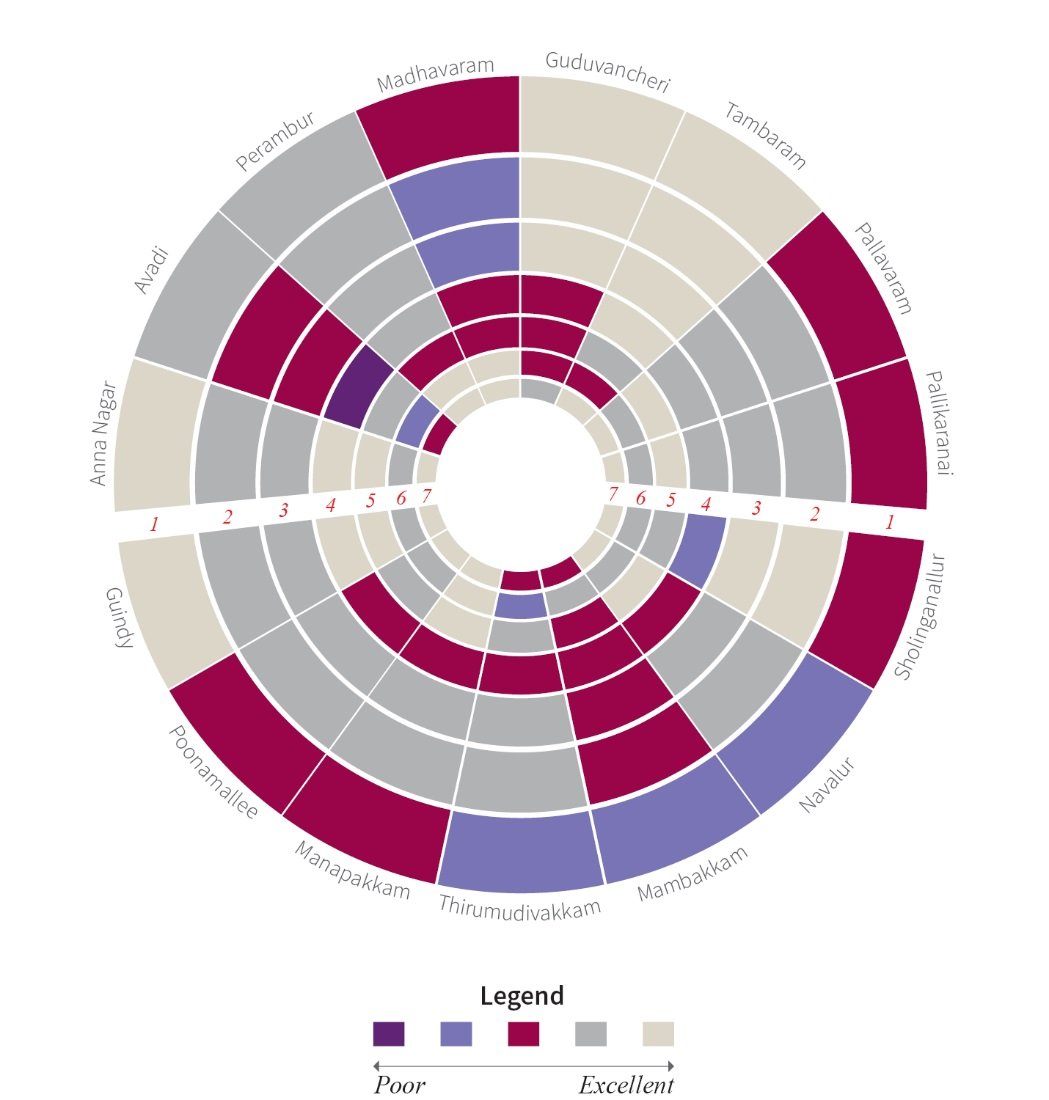

How to read this chart
- The chart rates every location on seven parameters (listed below)
- Every circle in the chart is numbered (1 to 7) and represents the concurrent parameter from the below table. For eg: The outermost circle is numbered 1 representing the parameter ‘Access to nearest MRTS station - Metro rail stations / Intra city train stations/ bus stations’
- Colors represent ratings which are on a scale of poor to excellent. Refer legend.
- For example: The rating for Pallikaranai for parameter 1 as per the colour code in the legend is average, for parameter 5 it is excellent and for parameter 2 it is average..
- Access to nearest MRTS station - Metro rail stations / Intra city train stations/bus stations
- Distance from nearest established business hubs or work places
- Travel time in peak hours
- Distance from nearest intercity railway station
- Distance from International airport
- Proximity to proposed infrastructure projects
- Access Road
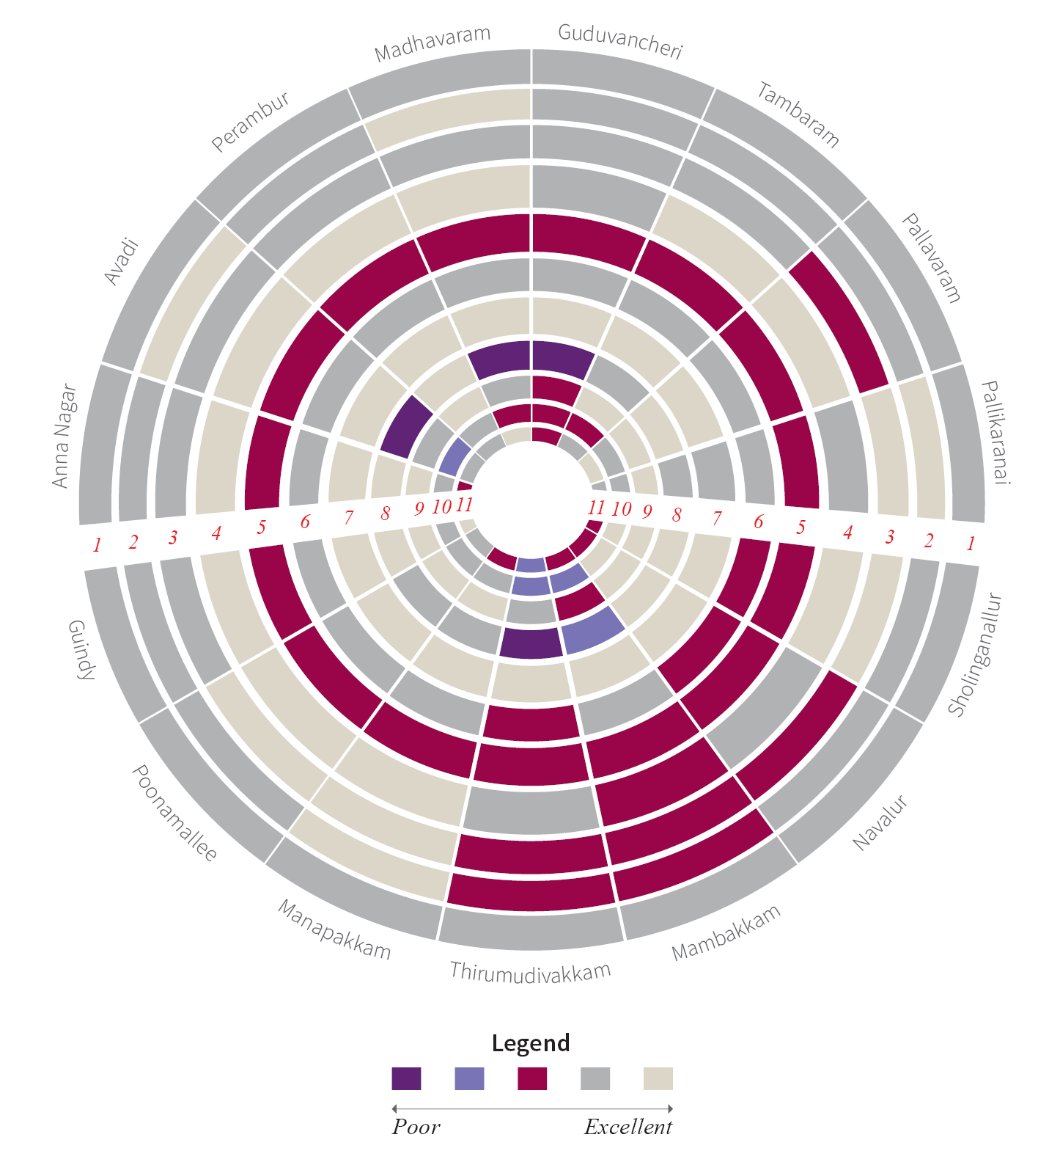

How to read this chart
- The chart rates every location on eleven parameters (listed below)
- Every circle in the chart is numbered (1 to 11) and represents the concurrent parameter from the below table. For eg: The outermost circle is numbered 1 representing the parameter access to schools
- Colors represent ratings which are on a scale of poor to excellent. Refer legend.
- For example: The rating for Pallikaranai for parameter 1 as per the colour code in the legend is nearing excellent, for parameter 2 it is excellent and for parameter 5 it is average.
- Access to Schools
- Access to Primary health care
- Access to Multispecialty Hospitals
- Access to daily shopping needs
- Security/ Law and order
- Water supply
- Power
- Access to Malls and Multiplexes
- Access to Restaurants and food courts
- Access to Youth friendly facilities
- Access to recreational facilities - city parks, zoo, theatre etc.
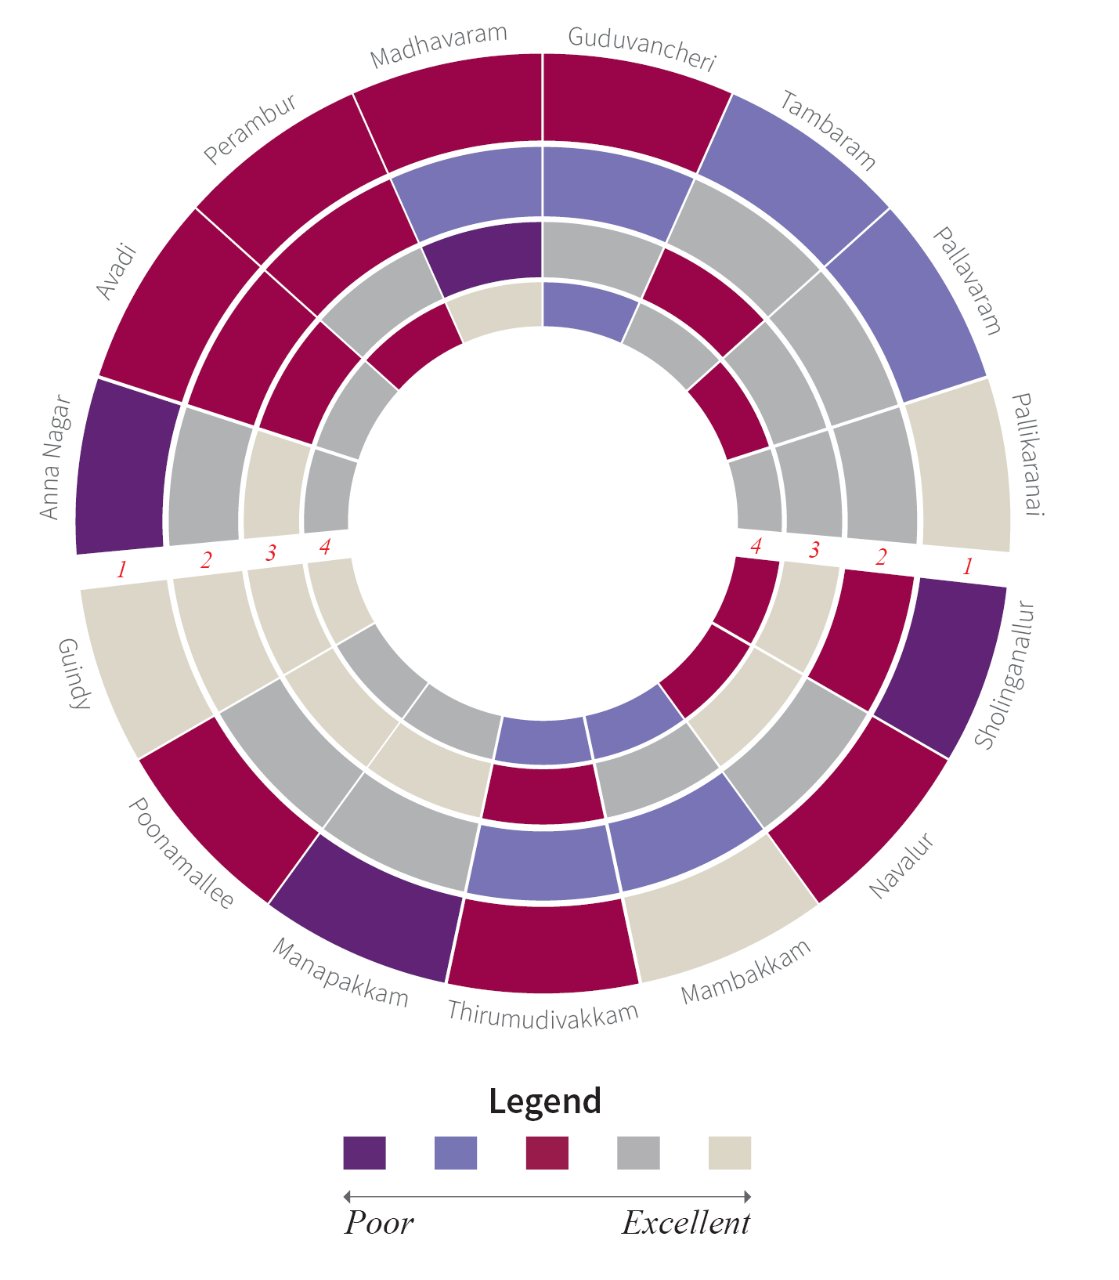

How to read this chart
- The chart rates every location on four parameters (listed below)
- Every circle in the chart is numbered (1 to 4) and represents the concurrent parameter from the below table. For eg: The outermost circle is numbered 1 representing the parameter Average Y-o-Y price appreciation in last three years
- Colors represent ratings which are on a scale of poor to excellent. Refer legend.
- For example:The rating for Pallikaranai for parameter 1 as per the colour code in the legend is excellent, for parameter 2 it is good.
- Average Y-o-Y price appreciation in last three years
- Market attractiveness - Cumulative of three years of sales in new launches against cumulative new launches
- Presence of good developments or developers
- % Sales penetration in last three years
Fill out this form to download report